Inside The Nonprofit Sector
From the National Council of Nonprofits:
What is a "Nonprofit"?
Charitable nonprofits embody the best of America. They provide a way for people to work together for the common good, transforming shared beliefs and hopes into action. They give shape to our boldest dreams, highest ideals, and noblest causes. America’s 1.3 million charitable nonprofits feed, heal, shelter, educate, inspire, enlighten, and nurture people of every age, gender, race, and socioeconomic status, from coast to coast, border to border, and beyond. They foster civic engagement and leadership, drive economic growth, and strengthen the fabric of our communities. Every single day.
The word "nonprofits": The term “nonprofit” means different things to many different people. It’s a commonly used word without a common understanding between writer and reader. People often use the words “nonprofit” and “tax exempt” interchangeably. Congress has created almost three dozen types of tax-exempt organizations in different sections of the tax code. These include Section 501(c)(4) (social welfare organizations, homeowners associations, and volunteer fire companies), Section 501(c)(5) (includes labor unions), Section 501(c)(6) (includes chambers of commerce), and Section 501(k) (child care organizations). Each section identifies certain conditions that must be met to be exempt from paying federal income taxes. The one common condition is not paying out profits (“no part of the organization’s net earnings can inure to the benefit of any private shareholder or individual”); hence the term, “nonprofit.” Section 501(c)(3) of the tax code refers to “public charities” (also known as charitable nonprofits) and “private foundations.” The tax code considers “churches and religious organizations” (which the IRS defines to include mosques, synagogues, temples, and other houses of worship) to be "public charities.”
Frequently Asked Questions About Nonprofits
Go to: https://www.councilofnonprofits.org/frequently-asked-questions-about-nonprofits
Myths About Nonprofits
While nonprofits are all around us, there are common misconceptions about what nonprofits are and what they do.
Myth: Nonprofits can’t earn a profit
Reality: The term "nonprofit" is a bit of a misnomer. Nonprofits can make a profit (and should try to have some level of positive revenue to build a reserve fund to ensure sustainability.) The key difference between nonprofits and for-profits is that a nonprofit organization cannot distribute its profits to any private individual (although nonprofits may pay reasonable compensation to those providing services). This prohibition against “private benefit” is because tax-exempt charitable nonprofits are formed to benefit the public, not private interests. For more information, see this IRS guidance. Learn about what charitable nonprofits need to do to maintain their tax-exempt status.
Myth: A well-run nonprofit should have low "overhead" costs
Reality: Operating costs, such as paying utility bills, rent, salaries, and investing in office equipment are referred to by a variety of names, including "overhead," "administrative costs," and "indirect costs." While the terminology varies, one thing does not: these costs are essential to delivering on a nonprofit's mission, and have no relation to the level of effectiveness or the outcomes a charitable nonprofit may deliver.
If you have two organizations that provide shelter and their roofs are leaking a bit (over head in the truest sense), with organization #1 doing cheap patches to keep their overhead ratio at 33 percent (but the leaks keep happening) and organization #2 has an overhead ratio of 38 percent because they replace the roof, which one is more effective? Or how about two organizations that just implemented new donor databases, one that has overhead of 31 percent and went with a cheaper, less secure solution, and the other has overhead of 37 percent because they went with one that emphasizes security. Which one do you want to donate to?
Myth: Nonprofits don’t have paid staff; they only use volunteers
Reality: According to the Johns Hopkins Center for Civil Society Studies and data from the Bureau of Labor Statistics, in 2016, nonprofits employed 12.3 million people - that's 10 percent of private employment in the United States!
Myth: Nonprofits can’t lobby
Reality: Every charitable nonprofit can and should make its voice heard on issues that are important to its mission and to the people or cause the nonprofit serves. As advocates, nonprofits are sometimes required to speak up about policies, laws, and regulations; lobbying by nonprofits is permitted by law. However, tax-exempt charitable nonprofit organizations are NOT permitted to engage in partisan political activity, such as supporting or opposing any candidate for public office. For more information on lobbying, see our advocacy resources.
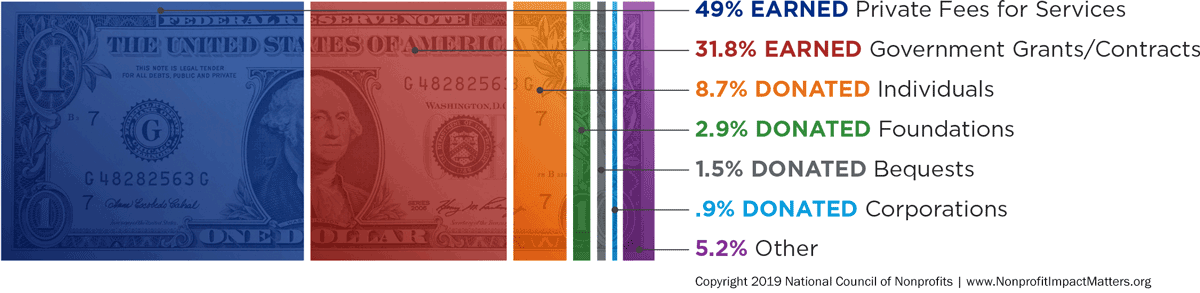
Myth: Nonprofits get most of their funding from foundations
Reality: Foundation grants represent only a small part of the total amount of dollars contributed each year to the charitable nonprofit community. Private philanthropy, which includes both donations and bequests from individuals and grants from private and corporate foundations, represents only 14% of the total annual revenue to the charitable nonprofit community, and of that, the majority is from contributions from individuals.
Myth: Charitable giving incentives only benefit wealthy individuals and elite institutions
Reality: All charitable nonprofits benefit from public support and donations, and most depend on private donations to serve their communities. While an individual taxpayer only receives a partial tax benefit for charitable donations, the community served by the charitable nonprofit receives the full value of every dollar. Any cap on giving incentives negatively affect the community. For more information see our resources on charitable giving incentives.
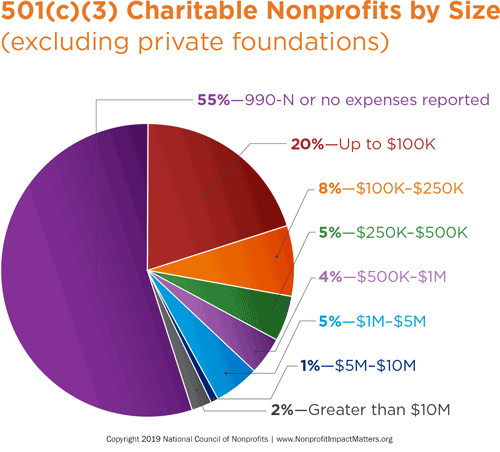
Myth: Most nonprofits are large and have many resources
Reality: In fact, most nonprofits are small in both budget size and numbers of employees. While large, well known nonprofits, such as the Red Cross, have high visibility, those nonprofits are actually not representative of the charitable nonprofit community as a whole. 92 percent of all reporting public charities had annual revenue of under one million dollars.
Research, Reports and Data on the Nonprofit SectorGo to: https://www.councilofnonprofits.org/research-reports-and-data-nonprofit-sector
From the National Philanthropic Trust:
General Philanthropy Statistics
- Americans gave $592.50 billion in 2024. This reflects a 6.3% increase from 2023.
- Corporate giving in 2024 increased to $44.40 billion—a 9.1% increase from 2023.
- Foundation giving in 2024 increased to $109.81 billion—a 2.4% increase from 2023.
- Giving by bequest in 2024 was $45.84 billion—a 1.6% decline from 2023.
- In 2024, the largest source of charitable giving came from individuals, who gave $392.45 billion, representing 667% of total giving.
- In 2024, the majority of charitable dollars went to religion (23%), human services (14%), education (14%), grantmaking foundations (11%), and public-society benefit (11%).
- Giving in 2024 increased in many sectors, with double-digit growth in gifts for public-society benefit organizations (19.5%), international affairs (17.7%), and education (13.2%). Giving declined precipitously to individuals (-11.9%).
Individual and Family Philanthropy Trends
The majority of donors (63%) prefer to give online with either a credit or debit card.
The number of new donors increased by 2.3% in 2023, the first increase in new donors since Q1 of 2021.
More than half of the families that chose a foundation as their primary vehicle (55%) did so in order to establish a long-term philanthropic legacy.
Individuals remained the largest donor segment in 2023, representing 67% ($374.4 billion) of all US giving ($557.2 billion), a growth of 1.6% over 2022 in current dollars.
The average annual household giving by generation is as follows:
- The Silent Generation (Born 1925-1945) with $1,367
- Baby Boomers (Born 1946-1964) with $1,212
- Generation Z (Born 1997-2012) with $785
- Generation X (Born 1965-1980) with $732 and
- Millennials (Born 1981-1996) with $481
80% of younger donors expressed interest in alternative investments like impact investing.
Charitable Organization Trends
- According to the most recent data available, there are more than 1.8 million recognized 501(c)(3) organizations in the United States.
- In 2024, 501(c)(3) organizations made up the majority of 501(c) organizations in the U.S., with 1.6 million.
- As of 2022, there were almost 13 million people employed in the U.S. nonprofit sector.
- There are approximately 350K religious, 261K educational, 160K human services, 134K arts & culture, and 66K public-society benefit nonprofit organizations in the U.S. in 2025.
Volunteering Trends
- An estimated 28% of U.S. adults—75.7 million Americans—volunteered between September 2022 and 2023, contributing an estimated 4.99 billion hours valued at approximately $167.2 billion.
- Generation X had the highest rate of formal volunteering (27%) compared to Gen Z, Millennials, and Baby Boomers.
- Baby Boomers had the highest rate of informal volunteering (59%).
- In 2023, the estimated national value of each volunteer hour was $33.49, a 5.3% increase from 2022.
- More than 54% of Americans—or 137.5 million people—informally helped their neighbors between September 2022 and 2023. This represents an increase of 3 percentage points over previous years. This translates into 12.9 million more informal helpers in 2023 than in 2021.
Donor Advised Fund Statistics
- There were 1,782,281 donor-advised fund accounts in 2023.
- Donor-advised funds held $251.52 billion in assets in 2023.
- Total contributions into donor-advised funds were $59.43 billion in 2023.
- Donor-recommended grants from donor-advised funds totaled more than $54.77 billion to charities in 2023.
- The average donor-advised fund account size was $141,120 in 2023.
- The average payout rate for DAFs was 23.9% in 2023.
- Compare the DAF payout rate to the mean payout rate of foundations in 2024: 8.7%.
What is the State of Philanthropic Giving?
Philanthropy in the United States has continued to evolve alongside cultural, economic, and technological shifts. Recent data shows that while overall charitable giving rose in 2024, growth was uneven across donor types and sectors.
- Individual vs. Corporate Giving: Individuals still represent the largest share of total giving, but corporate and foundation contributions are expanding faster, fueled by strong earnings and ESG-aligned initiatives.
- Generational Change: At the same time, giving by bequest slightly declined, suggesting broader demographic transitions and the generational transfer of wealth beginning to take shape. Younger donors are increasingly reshaping how and why they give. Surveys show that Millennials and Gen Z donors prioritize values-based giving, favoring transparency, social impact, and immediate results.
- Digital Giving: Technology also remains a key driver in modern giving trends. With a majority of donors preferring online platforms for donations, charities that invest in digital experiences—such as personalized communication, recurring giving options, and mobile-friendly platforms—are seeing higher engagement.
- Donor-Advised Funds: Many donors are turning to donor-advised funds as vehicles for philanthropy. This shift underscores a growing emphasis on long-term outcomes, collaborative funding models, and authentic engagement rather than transactional donations.
Together, these trends point to a more connected, strategic, and diversified future for philanthropy.